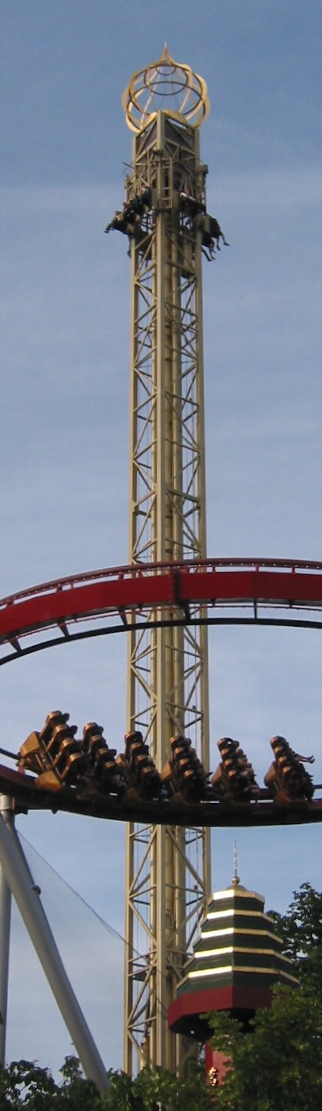
Det Gyldne Tårn -
The Golden Tower
Slowly you move up the tower. The ground is far below, and you still have a long way to go.
- During 20-25 seconds, the lift moves with nearly constant velocity to the highest point, about 60 m up. What forces act on you during this part of the ride?
- The graph below shows accelerometer and elevation data for the ride.
- At the top, you have about 7-10 seconds to enjoy the view.
How far can you see from the top? Use Pythagoras theorem to work out how far away the horizon is when you are h = 60 m above sea level. Can you see Malmö? Landskrona? Ven? Roskilde? Elsinor?
- The downhill motion starts and you are "shot" down, accelerating nearly twice as fast as during free fall. What are the forces on you during this part of the ride?
- Use the accelerometer graph to draw an approximate
graph over velocity and elevation as a function of time, and mark the different parts of the ride. Do you ever experience weightlessness?
- The fall lands on pressurized air, and a few up- and down bounces. During the first bounce, the accelerometer graph shows that you experience nearly 4g. What are the forces acting on you in that moment? What is your acceleration? Are there moments when the velocity is zero? At what times does the velocity have a maximum? Minimum (i.e. when is it most negative)?
- The diagram to the right show a graph of elevation versus velocity during the bounce.
You can draw this type of grahs e.g. for pendulums and harmonic oscillators. If there were no energy losses, the resulting diagrams would instead be closed ellipses. In the graph to the right, both elevation and speed variations get smaller with every bounce, until the ride comes to a complete stop. Read
more about Phase
Portraits.
To draw these and other graphs: Download the data, which can be used e.g. in spreadsheet programs or in matlab. You may want to look closer at acceleration and velocity during the start of the ride, or as you are shot down. You may have to make small adjustment to the acceleration data to ensure that the velocity approaches zero at the end of the ride. How large is the adjustment? How does it compare to the uncertainty in the data? (Data sheet for the sensor)
You may also compare the results for this ride to other Turbo Drop rides, such as Höjdskräcken at Liseberg
http://physics.gu.se/LISEBERG/tivoli/, April 2010
Ann-Marie Pendrill,