Acceleration in 1, 2, and 3 dimensions in launched roller coasters
Ann-Marie Pendrill, Department of Physics, University of Göteborg
Göeborg, Sweden
Ann-Marie.Pendrill@physics.gu.se
During a roller coaster ride the body experiences acceleration in three
dimensions. An accelerometer can
measure and provide a graph of the forces on the body during different parts of
a ride. To couple the experience
of the body to pictures of the ride and an analysis of data can contribute to a
deeper understanding of Newton's
laws. This paper considers the physics of launched roller coasters.
Measurements were performed with a three dimensional co-moving accelerometer.
An analysis is presented of the forces in the different ride elements of the
Kanonen in Göteborg and the Speed Monster in Oslo, which both include loops and
offer rich examples of force and acceleration in all dimensions.
|
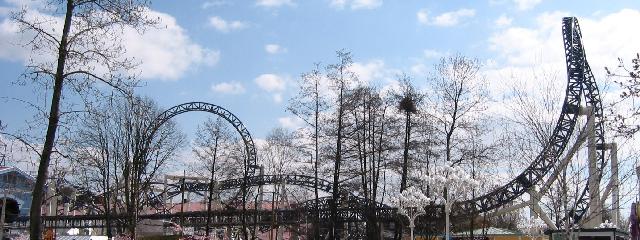
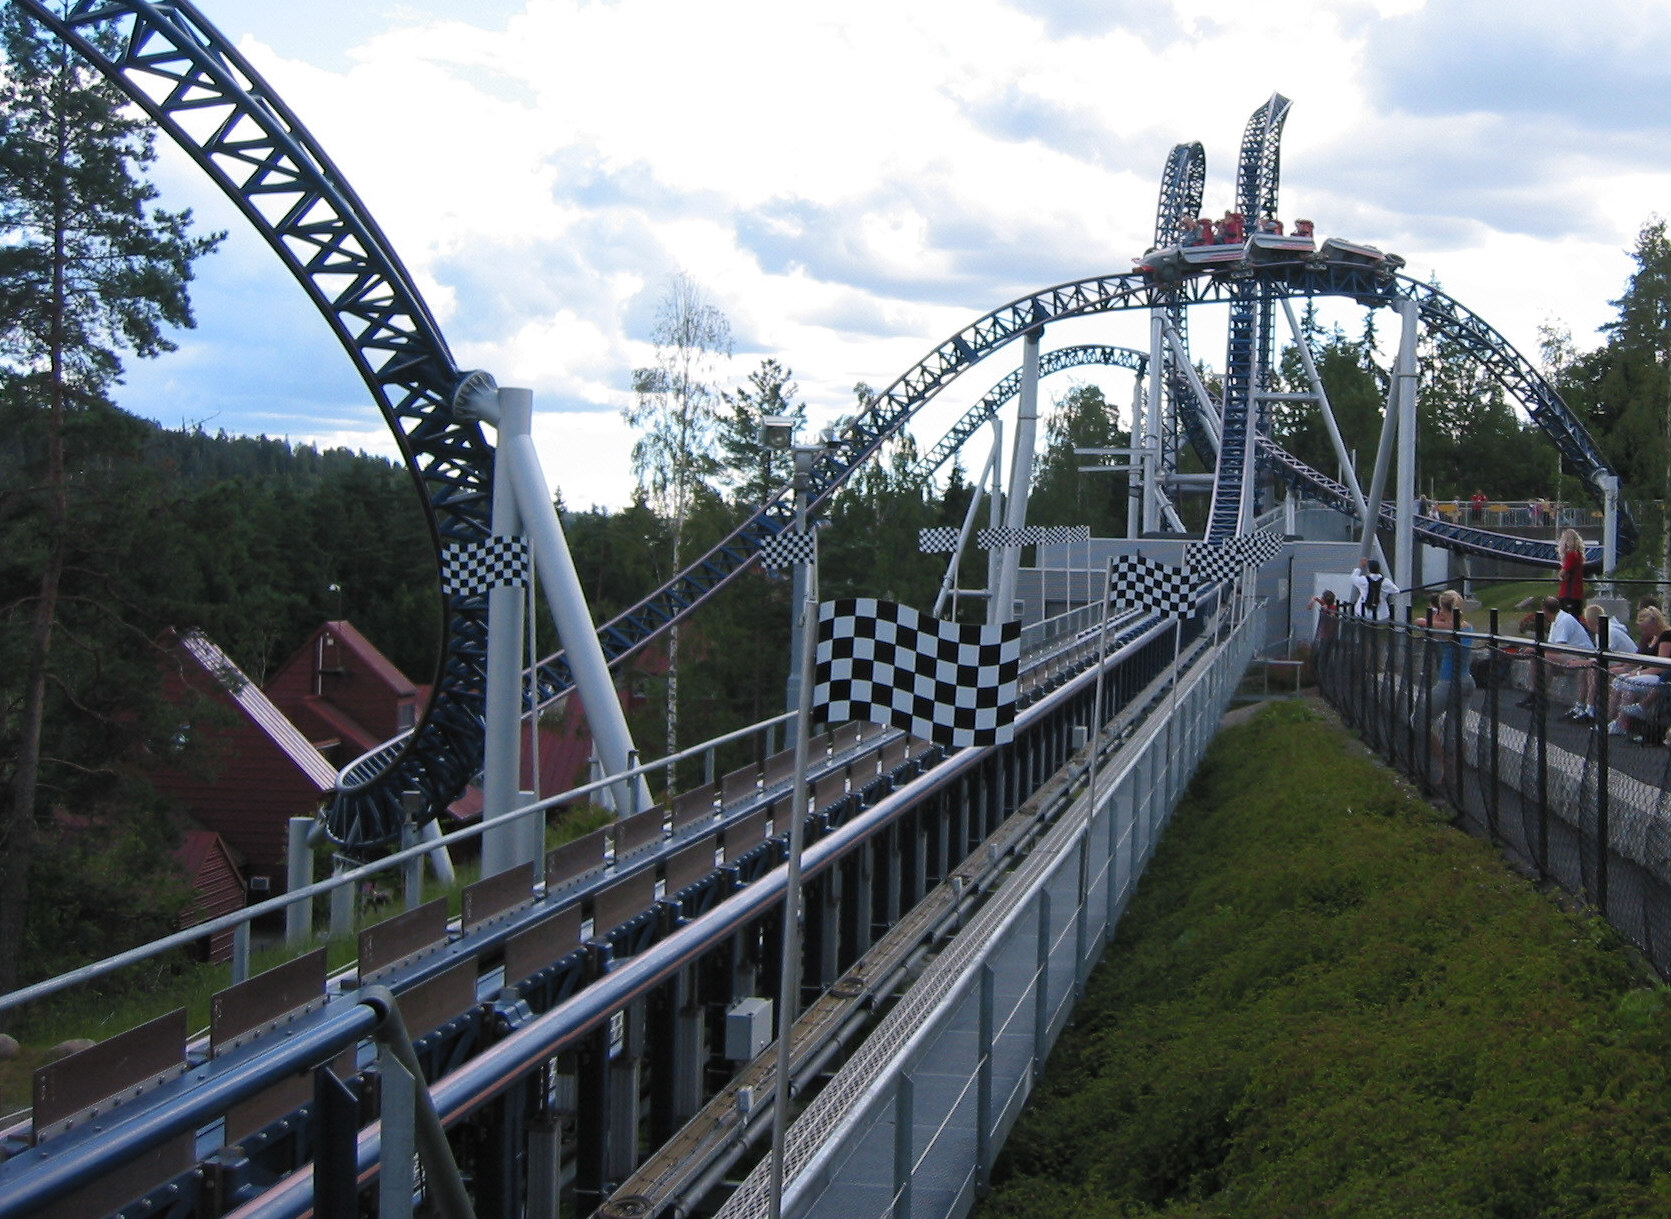
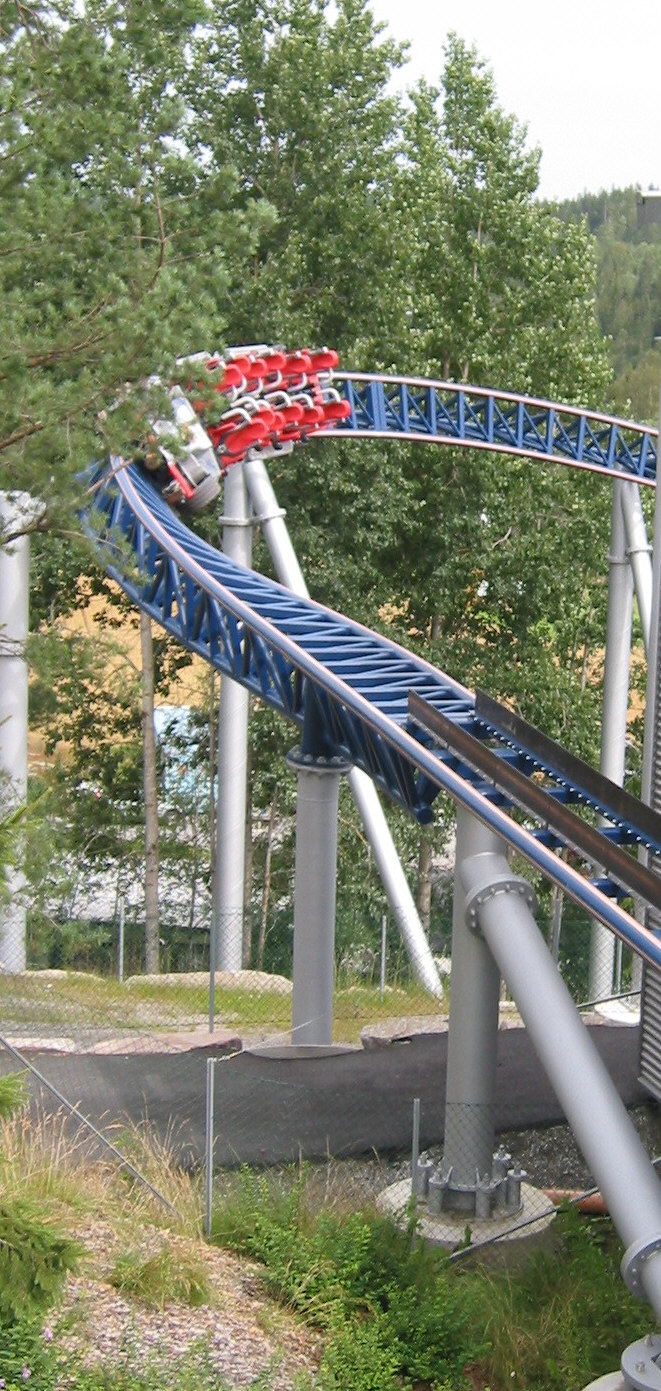
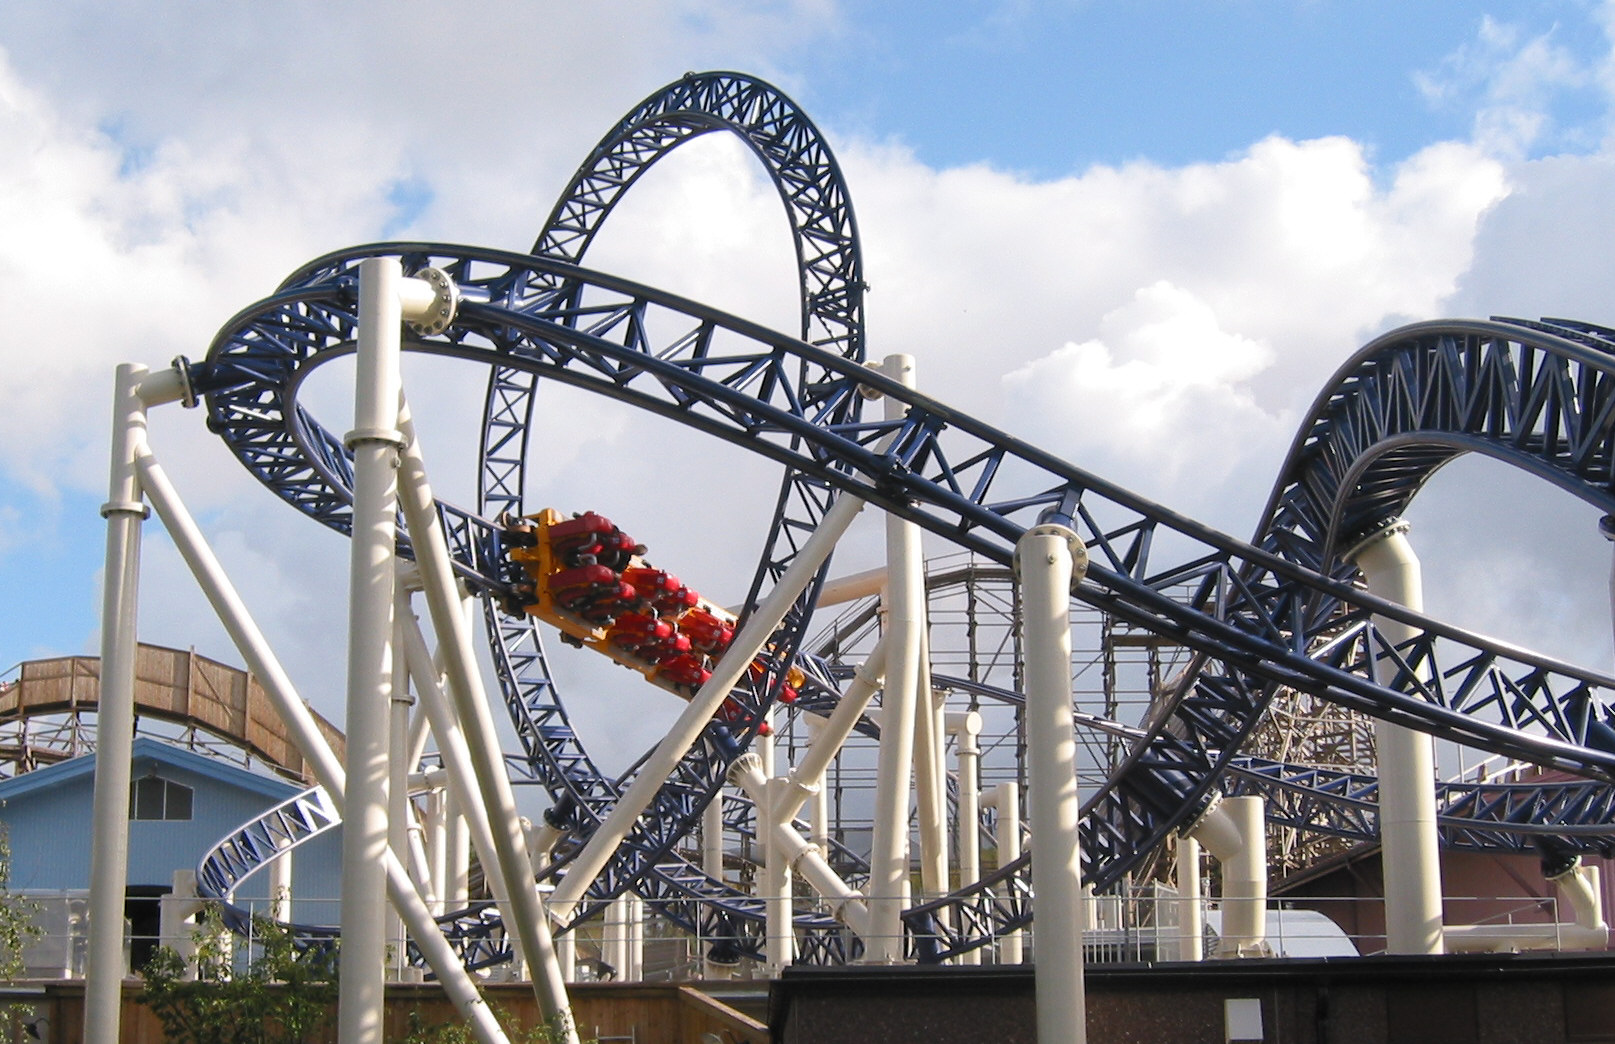
Figure 1: The Kanonen roller coaster viewed from the side, showing the
launch from the left into the top hat on the right, as well as the shape of the
clothoid loop.
|
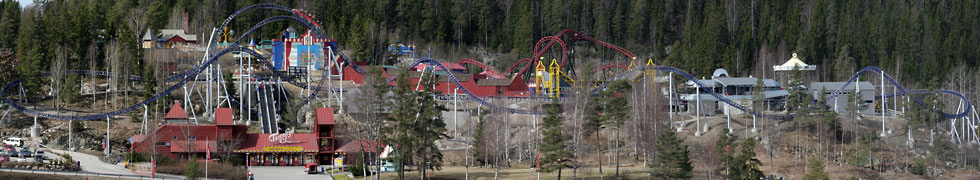
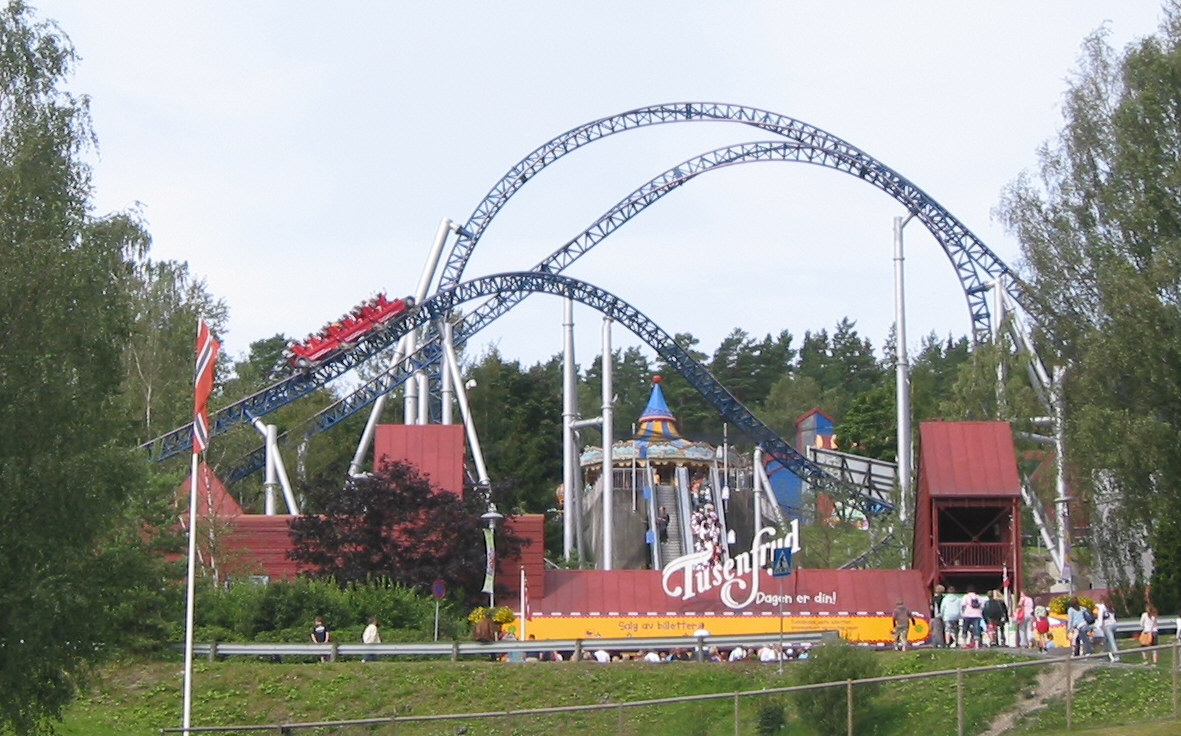
| Figure 2: Panorama of the Speed Monster. The launch is from the
right into the Norwegian loop, which encircles the entrance escalator. (Photo: Jochen Peschel, [1])
|
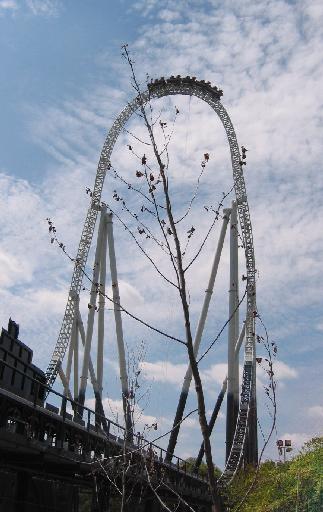
| Figure 3: The 62 m high "Top
Hat" of the Stealth coaster at Thorpe Park.
|
1. Introduction
3, 2, 1 ... launch! The traditional lift hill, which gives the initital potential
energy for the ride, is absent in some
newly build roller coasters. Instead, the initial energy is provided in the form
of a horizontal launch, giving
sufficient kinetic energy to bring the train to the top of the first hill. From
then on, the ride is characterised by the
interchange between potential and kinetic energy, in the same way as in
traditional roller coasters.
The first Intamin hydraulic launch coaster in Europe was Rita the Ride at Alton Towers, which
opened in April 2005, followed two
weeks later by Kanonen at Liseberg in Göteborg (Figure 1). The Speed Monster at
Tusenfryd in Oslo (Figure 2) and the Stealth at Thorpe Park (Figure 3)
both opened in 2006. In 2007, similar launch coasters were
added to Heide-Park in Germany and PortAventura in Spain [1-4].
The Stealth is the highest of the European launch coasters.
After the launch the
train passes the Top Hat (Figure 3) and then returns over a camel back into a
hairpin turn back into the station.
The Kanonen and Speed Monster roller coasters both feature a loop and a
screw during the ride. The
accelerometer data and elevation profile from these rides are shown in Figures 4
and 5, and disucssed in more
detail below.
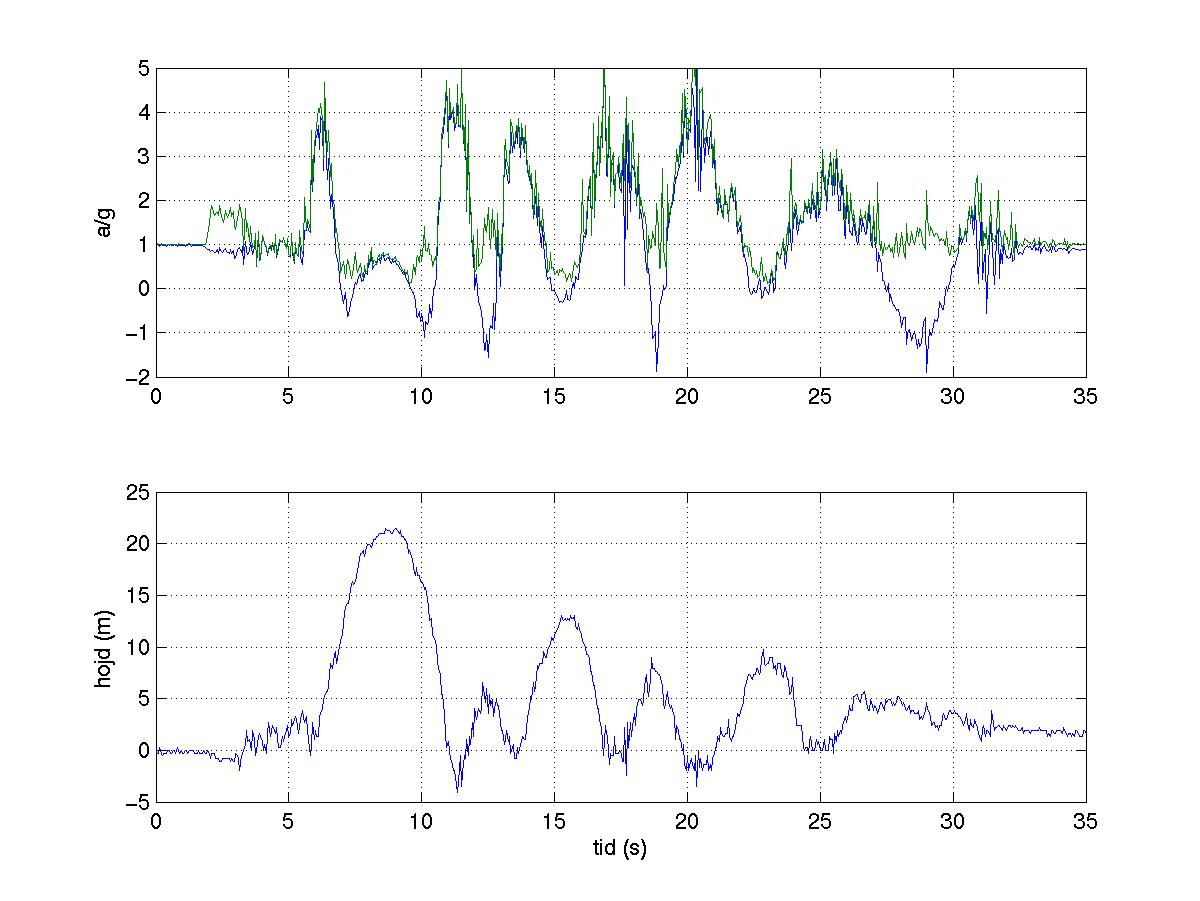
| Figure 4: Accelerometer and elevation data for
Kanonen.
The green accelerometer curve shows magnitude of the "g-force", whereas the blue
curve shows only the vertical component.
| Figure 5: Accelerometer and elevation data for the Speed
Monster.
|
| Figure 6: The launch of the Speed Monster, with a
side view of the "Norwegian loop". |
2. One-Dimensional Horizontal Motion
The study of motion in school traditionally starts with non-motion,
continuing with motion in one dimension. The traditional lift-hill is an
example of uniform rectilinear motion, where Newton's first law
applies. The launch is an example of accelerated motion in one dimension
- as is the final brake.
These situations can be useful as illustration to textbook
presentations.
In one dimension, the measurement of the acceleration in the direction
of motion gives full information about the
motions if the initial speed is known. The variation of speed and
distance with time is obtained by integration, which can be peformed
numerically or analytically, after approximation of the acceleration
time dependence.
The hydraulic launch also gives an example of applications of the gas
laws, as discussed in Section 2.2.
2.1 The launch
Flags in the launch area enhance the sensation of motion during launch
of the Speed Monster, as shown in Figure 6.
Horizontal launch of roller coasters have been used since the 70s,
e.g. in the
Revolution [2,3]
which is a Schwarzkopf "shuttle launch coaster" [5],
where the energy is stored in a
flywheel. Magnetic launch techniques were introduced during the 90s,
with "LIM"
- Linear Induction Motors" and "LSM" - Linear Synchronous
motors. Compressed air launch was introduced in 2002, followed by
hydraulic launch in 2002.
The hydraulic
launch was used to break a new altitude record in 2003 for the Top
Thrill Dragster at
Cedar Point Ohio. [2,3,6].
In the hydraulic launch, oil is pumped from a reservoir into storage
cylinders filled with nitrogen. The energy is built up as the nitrogen
is compressed to a pressure of around 300 bar. During launch, the gas is
allowed to expand rapidly, sending the hydraulic oil through the motors,
and energy is transferred to the accelerating roller coaster. The
technique is described in some detail by Peschel [4], who also presents
an animation of the launch process.
Figures 7 and 8 shows the accelerometer data for the Kanonen and Speed
Monster rides. The graphs also include speed and distance, obtained by
numerical integration. From the graphs in Figures 7 and 8, we can
conclude that the force drops
during the launch. This is natural since the pressure of the nitrogen
would drop as the
gas expands, as discussed below.
A fully loaded Kanonen train with 4 cars weighs about 8
tonnes. The Speed Monster train with 3 cars is lighter, about
6 tonnes. These weights include the
mass of the sled used during acceleration.
Exercises for the reader:
- What average power is needed to accelerate the trains?
In W? In horsepowers (1 hp=745.7 W).
- How does the power, P, vary during the launch? (Remember: P = Fv).
- How high above the starting point can the Kanonen and Speedmonster
trains go after launch?
| Figure 7: Horizontal acceleration (m/s2) for the Kanonen launch, together with velocity (m/s) and distance
(m) obtained through numerical integration. Which graph is which?
| Figure 8: Launch of the Speed Monster: Acceleration
(m/s2), velocity (m/s) and distance (s).
|
2.2. Gas Pressure During the Launch
The launch, itself, can be assumed to be an adiabatic process,
where
 For a diatomic gas, like nitrogen,
used for the launch,
For a diatomic gas, like nitrogen,
used for the launch,  =1.4.
The work done by the gas during adiabatic expansion is given by
=1.4.
The work done by the gas during adiabatic expansion is given by
According to the gas law, pV/T=constant, and this expression can be
used to relate the temperature during the adiabatic expansion to
the pressure or the volume.
The relations above can be expressed in terms of dimensionless
quantities depending on the ratio V/Vo. The maximum possible
work for an adiabatically expanding gas
would be
Wo=poVo/( -1),
which depends on the initial pressure and volume.
The drop in acceleration in Figures 4 and 5 correspond to a drop in
force and thus to the drop in pressure during launch, which can be used to
estimate the fraction of the maximum possible work
exerted by the gas during the Kanonen and Speed Monster launches.
| Figure 9: Photo showing the Speed Monster train just
before it enters the brakes. Braking is accomplished by magnets
on the train inducing
eddy currents in the metal sheets sticking up in the last parts of the track.
| | Figure 10: Acceleration, velocity and distance during the
braking of the Speed Monster train. The negative accelerometer data
indicate a retardation of the train.
|
2.3 Stopping the train
The last section of the Speed Monster track is shown in Figure 9, which
also shows the magnetic brakes in the last part of the track. Eddy
currents are induced by
rare-earth magnets on the train in the conducting metal sheets, the "braking
swords".
Magnetic brakes are also mounted on the launch track (see Figure 6).
These are taken down just before launch, but automatically rise when the
train has passed, to prevent the train from crashing back into the station,
should the initial energy be insufficient to reach the point of no return
at top of the first hill.
[6].
Magnetic brakes offer at smooth onset of the braking, as a successively
larger fraction of the magnets on the train come close to the braking swords.
Since the magnetic field induced in the swords is proportional to the
velocity of the magnets, and thus the train,
the braking force is then reduced with time after all parts of the train
have entered the braking region, leading to an exponentially decaying speed.
The kinetic energy of the train is converted to heat in the metal
sheets which cool off again well before
the next train arrives. This will be analysed in more detail in a
separate paper.
Both in Kanonen and in the Stealth, magnetic brakes are also mounted at
the end of the camel back which follows the initial "Top Hat". The
Speed Monster train, on the other hand, runs the whole
length of the track before encountering the final brakes.
The accelerometer data from the
braking are shown in Figure 10, together with
graphs
for velocity and distance, obtained from the data by assuming that the
train has come to a stop at the end.
Since the longitudinal acceleration component is measured along the direction of motion, a
negative value indicates a retardation of the train.
By integrating the accelerometer
data for the braking of the Speed Monster train, we find that the train has
entered the
final brakes with speed of 18m/s, compared to leaving the launch part
with a
speed of 22m/s.
(What fraction of the initial kinetic energy is lost during the ride?)
2.4 Energy Losses
How much energy is lost as the train moves along the track? The
layout of the Speed Monster makes it possible to obtain an estimate, by
using
the Speed Monster panorama photo in Figure 2 which shows how the hills
and valleys of the corkscrew become slightly lower with every coil.
(Technically, only the last hill is considered as part of a corkscrew
since the torsion of the track in the first two hills
brings the train to the top of the track without any inversion.)
Make a larger copy of the photo and draw a line beteen the highest
points of the track. You can also draw a similar line between the
lowest points. Measure (in mm on the photo) how much the altitude, H,
changes for a given horizontal distance, D. Before working out a number,
we should also account for the additional distance due to the circular
motion. The diameter, 2R, of the circle can be obtained from the
distance between the lines connecting the upper and lower points,
respectively. As the train moves a distance L to the right, while
completing a whole turn, it also moves a distance
2 R around the
circle, giving a total distance
R around the
circle, giving a total distance
 .
.
The ratio
 .
.
can be taken as an estimate of the "effective" friction coefficient,
which includes air resistance and other losses. For cold and
empty trains, the relative energy losses can be more larger, as much as 4cm/m [10]. This
must, of course, be allowed for in roller coaster design, so that even
these trains can make it safely back to the station.
Exercise: How does the estimate of the energy losses
from the photo agree with the comparison of
train speed just after launch and just before the brakes? (At this
point the track lies 1m lower than the track directly
after launch [10], and the track length is 690m.)
3. Acceleration measurements in three dimensions
In roller coasters, as in everyday life, acceleration is rarely restricted to
one dimension.
The forces required for the acceleration in a roller coaster are evident
throughout the body.
What the body can experience can also be measured with a co-moving sensor. Since
the body moves in the
gravitational field, g, from the earth, the additional force per mass
unit required to obtain an
acceleration, a, is (a-g). What is measured by an
accelerometer is thus, in general not acceleration,
but one or more components
of
this vector. Since the gravitational acceleration is used as a
reference, it is natural to give results in terms of the ratio
(a-g)/g.
This expression can be taken as a vector definition of "g-force".
The accelerometer data in this paper were obtained using a wireless dynamic
sensor system [7].
This system also also measures air pressure and converts the barometer data to
provide indications of altitude during the ride.
Through Bernoulli's principle,
the altitude data are influenced by speed, thus leading to an overestimate of
altitude for high speeds. (This can be seen, e.g. around launch in
the graphs in Figures 4 and 5.)
3.1 Coordinate system for amusement ride acceleration data
The experience of the body depends on the orientation.
A natural coordinate system to describe the experience follows the moving body,
thus changing direction throughout the ride, and this is also the coordinate
system used by the sensor to record
the motion. Here, we define the positive z-axis to be the "vertical" axis
directed along the spine
towards the head of the rider. The positive x-axis points to the front of the
rider - in most roller coaster rides,
including this one, the x-axis concides with the direction of motion.
The y-axis gives the direction of "lateral" g-force.
In a right-handed system it will point out to the left of the rider.
Apart from launch and brake, the longitudinal component should vanish if
friction and train length are neglected. Except for screw elements in a
roller coaster, lateral components vanish if the curves are perfectly banked.
A problem in measuring acceleration in three dimension is to keep the sensor
axis aligned with the body
axis.
When the sensor is kept safe in a vest on the body, the z axis tends to
slope slightly backwards.
and sometimes also sideways.
A mathematically simple option is to use the
magnitude of the vector |a-g|,
possibly incorporating the sign from the
dominating vertical component to maintain "negative g" readings.
The Kanonen data in Figure 4 shows a comparison
of the total g-force and the vertical component.
When also the other coordinates are of interest, as for launch, break and
roll, is necessary to
perform a coordinate transformation.
The data in this paper were transformed
by rotating the axes so that the data
has only a vertical component before the ride starts, and
assuming that the sensor orientation relative to the track is fixed.
| Figure 11: The "Norwegian Loop" of the
Speed Monster coaster encircles the roller coaster entrance to the park, making
possible a very large loop. In view of the short Speed Monster train, the
ratio between train length and loop radius thus becomes unusually small
in this case.
|
4. Two-Dimensional Motion in Loops
Both the Kanonen and the Speed Monster include loops, where the train
moves essentially in two dimensions.
The photos in Figure 1 and 11 show that neither the loop in Kanonen nor in
Tusenfryd is a perfect circle. In a circular loop,
weightlessness at the top would be accompanied by
6g at the bottom of the loop (neglecting energy losses and the length of the
train). To reduce the load on the body, the shape of the track has a larger
radius of curvature at the bottom. This can be achieved in different ways as
as discussed in more detail in [8,9].
The Kanonen loop is a classic "clothoid loop", which was introduced by Werner
Stengel in 1976 in the roller coaster
Revolution [2,8].
In traditional roller coaster loops, the train enters the loop from below.
The Speed Monster train instead enters the loop from above.
This feature, conceived by project director Morten Bjerke at Tusenfryd,
makes the Speed Monster loop unique. Is is
classified as a "Norwegian loop" in the Roller Coaster Data Base [2]. It gives the
rider two inversions, both during
entrance and exit from the loop.
The Kanonen train passes the highest point at the time 15 s in the data
series in Figure 4, showing essential
weightlessness at the top and close to 4g during entrance to and exit from the
loop. Similarly, the Speed Monster
rider is essentially weightless at the entrance and exit from the loop
(at 10s and 15s, respectively, in Figure 5, while experiencing close to
4.5g at the bottom.
Comparing the loop shapes, we see that, whereas the traditional loops are
somewhat narrower than a circle, the larger curvature at the bottom of the
Norwegian loop leads instead to a slightly wider shape.
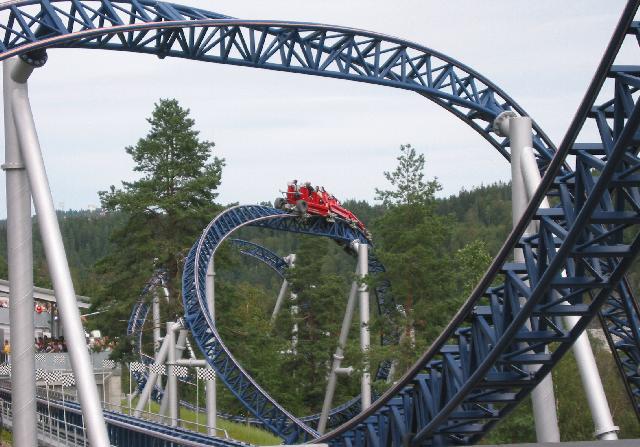
| Figure 12: The large corkscrew of the Speed
Monster. Technically, only the last hill is considered as a
corkscrew element, as noted in Section 2.4:
The track twists so that the train runs on top of the track in
the first two coils. Only the last coil leads to an inversion of the
rider. The train position in the photo corresponds to t=33s in the graph
in Figure 5.
|
5. Three-Dimensional Motion in Corkscrews
The picture of the Speed Monster launch (Figure 6) also shows the large Norwegian
loop from the side. All of the loop is nearly in the same plane. Separating the
coils by a larger distance would lead to a corkscrew,
such as in the Speed Monster, as seen in Figure 2 and Figure 12.
A corkscrew can, as a first approximation,
be described in cylindrical coordinates, where the circular motion with a
radius R is then accompanied by a perpendicular motion along
the cylinder axis. In the photo of the corkscrew in Figure 12 the track seems a bit flattened at
the top. At the same time, the track
twists, so that the heartline of the rider moves more along the cylindrical
shape.
Let L denote the distance
between the coils along the axis. For the train to move a full coil, it then
moves a distance 2
R around the
circle and L along the axis. The velocity component along the cylinder axis is
unchanged during the motion.
The angle of the track to the axis is given by
Exercise:
- Show that a train moving with speed v along a corkscrew track leads to a
centripetal acceleration with magnitude
- Show that the difference between the g-force at the top and bottom of the
corkscrew is given by
In the formula above, the first 2g arise due to the different direction
of the body relative to gravity, when the rider stays on the inside of
the screw and is upside down at the top. This obviously does not apply in
situations, such as Figure 12, where the train has twisted around to the
top of the track in the highest point.
Corrections may also arise due to the motion of the train around the track.
Any difference in radius of curvature between the high and low points
also leads to a change in g-force difference to what is expected from
these formulæ.
5.1 Speed Monster corkscrew
The corkscrew in the Speed Monster is quite stretched, making good use of
the available space, as seen from the panorama picture in Figure 2.
In the Kanonen ride, the corkscrew is stretched to the point where the
riders move along a straight line while the track
twists around them, giving a ratio R/L close to zero.
As an exercise, estimate R/L for the Speed Monster corkscrew from Figure
12. Use this ratio to estimate the difference in g-force for the different
parts of the ride. Does your result agree with the accelerometer data in
Figure 5, where the corkscrew spans the period of about 10 seconds,
starting at t=28s.
Are there any deviations from expectations that would prompt you to
additional observations or measurements in the park?
|
Figur 13: The photo shows the Kanonen train on the way back through the
loop into the heartline roll,
where the center of mass of the rider moves essentially along a straight line.
|
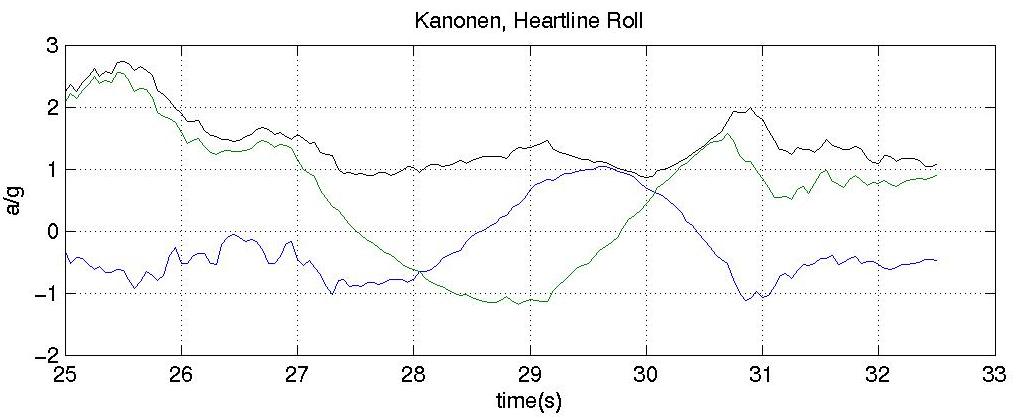
5.2 The Heartline Roll of Kanonen
During the way back to the station, the Kanonen train performs a show-off
passage over guests in the queue (Figure 13). The
track turns about 270 degrees in a "heartline roll".
The body's centre-of-mass
moves with nearly constant
velocity. What forces act on the body? Figure 14 shows the accelerometer data
for this part of the tour.
It is tempting to beliew that measurement with a three-dimensional
accelerometer gives a complete
description of the motion, which can be used to recreate the shape of the track.
However, the accelerometer data
between 27 and 30 s in Figure 14 could be obtained without rotation by moving
up-down and left-right, some
twenty meters in each direction (although the altitude profile does, indeed,
show that this was not the case).
Newton's first law tells us that body remains in uniform rectilinear motion
unless acted on by unbalanced forces.
However, when the "body" in Newton's laws is our own it is clear that the direction of the forces
relative to the body matters - we
are not point-like particles. A "motion tracker" needs to measure also
rotation around the three axes to get a
complete description of the motion. [11]. Nevertheless,
three-dimensional accelerometer data
provide much material for analysing familiar motions.
|
Figur 14: Accelerometer data for the "heartline roll".
The vertical and lateral components are shown together with the total g-force on
the body. Since the body moves with essentially constant velocity, the total
force from the train on the body is mg, counteracting the force of gravity
througout the roll. However, the direction is changed relative to the rotating
coordinate system of the body and of the accelerometer.
|
6 Personal experiences
6.1. The Wireless Sensor System
The WDSS system [7] is extremely simple to use. Once setup from the computer, if can
be used by a large number of students to collect data over a whole
afternoon. It
is, however, important to keep notes of what rides have been studied, since no
additional information is stored on the sensor. Should the memory fill up, the
data are quickly transfered to a laptop, and the sensor is again ready for
additional measurements.
The measuring vest, although not particularly æsthetically pleasing,
seems to convince ride attendants that the wearer is serious. Most
importantly, the vest keeps the sensor from falling out during the ride - safety
concerns must always come first.
A disadvantage is, however, that it is difficult to keep the coordinate axes
aligned [12], but in most cases this can be dealt with afterwards.
One dimensional accelerometer data are sufficient to obtain velocity
and position rectilinear motion, at least in principle.
In three dimensions, accelerometer data for three axes must be
complemented by rotational data around all axes,
for a complete description of the motion, as discussed by
Pendrill and Rödjegĺrd [11], in connection with the analysis of
motion tracker data for a
roller coaster. Still, the simplicity of use for the WDSS sensor makes it a
useful tool bringing the amusement park experience to the classroom.
6.2 The Coasters
Although a 3D accelerometer records the time series of forces acting on the
body, it can obviously not capture the whole experience.
Part of the experience is the build-up of expectations during the time in the
queue. The Stealth queue at Thorpe offers TV screens with its own disc-jockey. During my
one-hour wait to get on (Aug 2006), people in the queue were dancing to the music, in
general having a good time. There was also the occasional speaker message
telling NN to get "back to the entrance where mum has got a FastTrack
ticket for you". Just before entering, the riders are brought
in close view of parts of the launch technology.
The queue also lets you look up toward the 62 m high Top Hat (Figure
3), and I have to confess that it was the first time in many years that I had
the feeling "am I really going to go on that ride". But, yes, I did, and
even got a FastTrack ticket for a second ride. The long period of acceleration
followed by weightlessness is quite a strong experience.
Both the Kanonen and the Speed Monster offer good views of different parts of the
ride as the queue moves on. The best queueing experiences are, of course, during
off-season, when you don't have to wait more than a few minutes to board the
train.
Rita - Queen of Speed, Kanonen and the Speed Monster all have slower speeds
and lower hills than the Stealth. Rita - Queen of Speed reaches a higher speed
(98 km/h) than the Scandinavian launch coasters, but the ride heights at
Alton Towers are limited by the tree tops. The speed gained from the launch is
instead used in a helix with an extended period of relatively strong g-forces.
The whole 640 m tour in Rita the Ride lasts 25 seconds, which may seem a bit
short after a long time in the queue. Alton Towers has more
rewarding roller coaster rides!
The Kanonen and the Speed Monster both turn the rider upside down a few times
during the ride, in loops and screws, discussed above. Although the inversions
could be captured by a rotational sensor, the visual experience could not.
The Kanonen launch goes across a small river, giving the riders the impression
of falling into the water after the Top Hat. The Speed Monster has a most
spectacular track layout, encircling the entrance escalators. It
runs on a hillside, and brings the rider through the terrain, close
to the tree tops.
The Kanonen track is woven back and forth, making maximum use of a small
available area. Its complicated structure is more difficult to memorise,
which possibly brings more surprises to the rider.
The Speed Monster makes use of the natural drops to bring the train
considerably below the
starting point, thereby increasing the maximum speed.
The ride is only about 2 s longer than the Kanonen ride, as seen from
the accelerometer data. However, the difference feels larger, possibly
because the Speed Monster track is more than
50% longer: 690 m compared to 440m.
(The Stealth tour is even shorter, 400 m.)
The longer track also accounts for the smoother ride, where more distance
is allowed for the different elements [10].
Which coaster is the "best"? To some extent this depends on your personal
preferences. The results from annual voting by riders can be found at
BestCoasterPoll [13].
6.3 Lessons in the Amusement Park or Roller Coasters into the Class Room?
Is it best to have physics lessons in the amusement park or to have lessons in
school about physics in amusement rides?
Even without easy access to an amusement park, most students are
likely to have been on the rides and can relate the experience of their
body to the physics description of the rides.
Swings in a nearby playground are a
good way to introduce amusement park physics [14].
Disucssion of forces in the rides are likely to change students'
way of thinking during future park visits, as many students have told.
As with all field trips [15], the learning outcome from an amusement park visit depends to a
large extent on the preparation.
Several www sites provide material for preparing amusement park
visits [e.g. 16, 17]. Some parks, including Alton Towers and Thorpe Park, offer
educational programs
for visiting school classes [18,19]. Thorpe Park also quotes education secretary
Alan Johnson "Learning outside the classroom should be a the heart of
schools' curriculums and ethos."
Measurements in the park can easily overshadow
analysis, which is left for later. Back in the classroom,
the rides are no longer at hand for
investigating questions arising from the data.
The balance between measurement and analysis is worth careful consideration.
The analysis of measurement data also takes somewhat different forms
depending on what data can be obtained from the park. Drawings are
usually secret, on demand from the park, the designer, or both.
The length of a roller coaster
train can, however, usually be obtained. (If not, it
can be estimated by measuring the width of the gates in
the boarding queues.) It can provide a length scale for
analysis of different elements of the roller coaster from photos or video clips.
The length, combined with the time of passage at a
given point gives a speed measurement. Comparing timing from stop
watches of a number of students' mobile phones provides good material for
discussions of measurement uncertainty. Sometimes the track layout also
makes it possible to estimate energy losses from measurement of the time
of passage.
I find that every time I get new data from a ride, they give rise to
questions, and an urge to go back and check. Now, I would like to go back to
Tusenfryd. I would like to time the train as it comes around the last curve, and
possibly also make a video clip, to check the speed estimate in Figure
10. I would
also take a good look at the corkscrew to see if what looks like
an extra large radius of
curvature at the bottom of one of the coils can explain the dip in
g-force around 35 s
in Figure 10 - and I would need to ride it again to feel that dip.
I would also like to feel the "negative g-force" at the top of the first
coil (Figure 6, at about 28 s in the data shown in Figure 5).
Measurements are not only about numbers, but about questions, answers and
insight.
Acknowledgements
First, I would like to express my appreciation to roller coaster
designer
Werner Stengel for kindly sharing part of his
knowledge about various aspects of roller coasters,
including loop shapes, trim brakes and energy losses.
I would also like to thank Jochen Peschel from Coasters and
More for the permission to use the photo in Figure 2, and for
interesting e-mail correspondence.
Finally,
I would like to thank the helpful people at Liseberg and Tusenfryd, in
particular Ulf Johansson and Morten Bjerke, for practical help and for
stimulating discussions.
References
- Peschel J 2006 Speed Monster - Powerrausch am Felshang,
Coasters and More,
http://www.coastersandmore.de/rides/speedmonster/speedmonster.shtml
- Marden D 2007 Roller Coaster Data Base, http://www.rcdb.com
- Marden D 2003 3,2, 1, Launch, FunWorldMagazine, Juli 2003,
http://www.iaapa.org/industry/funworld/2003/Jul03/Features/3_2_1_Launch!/3_2_1_Launch!.html
- Peschel J 2007
Xcelerator - Intamins Accelerator Coaster Premiere, Coasters and More,
http://www.coastersandmore.de/rides/xcel/xcelerator.shtml
, Kanonen - great firepower at Liseberg, Coasters and More,
http://www.coastersandmore.de/previews/kanonen/kanonen.shtml and
http://www.coastersandmore.de/rides/kanonen/kanonen_eng.shtml
- Schwarzkopf A (1979) Amusement Ride with vertical track loop
Patent No.
US4165695, DE2703833
- Higgins A (2003) The Coaster with the Moster,
Machine Design,
http://www.machinedesign.com/ASP/strArticleID/55720/strSite/MDSite/viewSelectedArticle.asp
- Vernier Wireless Dynamic Sensor System (WDSS), http://www.vernier.com/labequipment/wdss.html,
- Schützmannsky K 2001
Roller Coaster - Der Achterbahn-Designer Werner Stengel
and Ingenieurbüro Stengel, http://www.rcstengel.com
- Pendrill A-M 2005 Roller Coaster Loop Shapes,
Physics Education, 40 517-21
- Stengel W 2007 Private communication
- Pendrill A-M and Rödjegĺrd H 2005 A Roller Coaster
Viewed Through Motion Tracker Data , Physics Education, 40
522-26
- Butlin C A 2006 Flying high with sensor system, Physics
Education, 41 577-9. Figure 3 shows the spillover from the
vertical accelerometer reading,which results when
coordinate axes are not correctly aligned.
- Hawker M 2007
http://BestRollerCoasterPoll.com
- Pendrill A-M and Williams G 2005
Swings and Slides, Physics Education, 40
527-33
- Rennie L R and McClafferty T P 1996
Science Centers and Science Learning,
Studies in Science Education 27 53
- Bakken C 2007 Physics/Science/Math Days
@ Great America, http://physicsday.org
- Pendrill A-M 2007 Science in the Liseberg Amusement Park, http://physics.gu.se/LISEBERG/
- Thorpe Park Education Programme,
http://www.thorpepark.co.uk/groups/schools.asp
- Alton Towers,
http://www.altontowers.com/ (Groups and Schools bring you to the
educational programme)
http://physics.gu.se//LISEBERG/eng/launch.html
AMP, draft, 10 August 2007, updated 28 Dec 2007
