
Figure 1: The lift hill and first drop of the Balder roller coaster at Liseberg |
1) Department of Physics, Göteborg University, SE-412 96 Göteborg,
Sweden
Ann-Marie.Pendrill@physics.gu.se
2) Imego AB, Arvid Hedvalls backe 4, SE 411 33 Göteborg, Sweden
Henrik.Rodjegard@imego.com
Abstract
A motion tracker measures acceleration and rotation in three dimensions, sufficient for a complete determination of the motion. In this article, a roller coaster ride is analysed with reference to motion tracker data. The use of this type of data in education is discussed as a way to deepen student understanding of concepts related to force and acceleration.
|
Figure 1: The lift hill and first drop of the Balder roller coaster at Liseberg |
A motion tracker sensor measures acceleration and rotation around three axes. In contrast to velocity, acceleration and rotation are absolute. The measurements thus reflect the experience of the body. Data for 3D-acceleration and rotation are sufficient to give a complete description of the motion. Through matrix operations, the results can be transformed between different coordinate systems.
Inertial navigation is only one of the applications, that makes use of measurements of the speed of rotation around a given axis without resorting to external measurements. A micromechanical gyro can, e.g., be used for deployment of airbags, measurements of angular vibrations and real-time control of 3D-images for computer graphics. Biomechanical measurements of a person's motions are useful e.g. in sport training, and in physical therapy. Beowulf weighs less than 100 g and includes three micromechanical "butterfly gyros" with two small wings connected to an outer frame using three flexible beams. Using electrodes, the wings are made to vibrate so that the masses on opposite sides of the beams will vibrate towards each other. A rotation of the whole structure around the axis between the wings then results in a Coriolis force perpendicular to the gyro structure and to the motion of the masses. This results in a torsional motion, which can be detected by a second set of electrodes, giving a signal proportional to the speed of rotation. [1]
In amusement rides, it is obvious that the experience of the body depends on the orientation. A natural coordinate system to describe the experience follows the moving body, thus changing direction throughout the ride, and this is also the coordinate system used by the sensor to record the motion. Here, we define the positive z-axis to be the "vertical" axis directed along the spine towards the head of the rider. The positive x-axis points to the front of the rider - in most roller coaster rides, including this one, the x-axis concides with the direction of motion. The y-axis gives the direction of "lateral" g-force. In a right-handed system it will point out to the left of the rider [2].
Figure 2 shows only the z-component of (a-g)/g. Except for the time in the lift hill, the x and y components would vanish in a perfectly banked roller coaster if friction, as well as the length of the train, could be neglected. Figure 2 shows also angular velocities around the axes defined above. In the context of flight (and also, e.g. satellite navigation /attitude control), the rotations around these x-, y- and z-axes are referred to as "roll", "pitch" and "yaw" [3].
We first consider the rotations around the z-axis, and note that
the initial right turn shows up as an increasing negative angular
velocity. This increase is a consequence of the downhill slope, causing
the train to gain speed. Integrating the angular velocity over the time
of the first turn shows that it is about 180o (i.e.
 radians).
This holds also for the following turns in Balder,
showing, e.g., that it involves no up- or downhill spirals, where the
accumulated angle of rotation would be much larger.
The long periods without rotation around the z-axis
indicate that the motion of the Balder trains resembles a shuttle in a loom,
up and down, out and back. All turns take place in relatively high positions,
resulting in moderate g-forces during the turns, and contributing to the rider feeling light during the ride. The local height maximum
leads to a speed minimum and to a corresponding minimum in angular velocity, which can be observed for many of the turns in the graph.
radians).
This holds also for the following turns in Balder,
showing, e.g., that it involves no up- or downhill spirals, where the
accumulated angle of rotation would be much larger.
The long periods without rotation around the z-axis
indicate that the motion of the Balder trains resembles a shuttle in a loom,
up and down, out and back. All turns take place in relatively high positions,
resulting in moderate g-forces during the turns, and contributing to the rider feeling light during the ride. The local height maximum
leads to a speed minimum and to a corresponding minimum in angular velocity, which can be observed for many of the turns in the graph.
An initial positive rotation around the x-axis accompanies right turns, when curves are banked. Similarly, a corresponding negative rotation around the x-axis follows at the end of the turn when the banking ends, bringing the rider back to an upright position. The data for rotation around the x-axis shows that Balder includes no screw - all rotations around the x-axis are significantly less than 90o before being followed by a counter rotation.
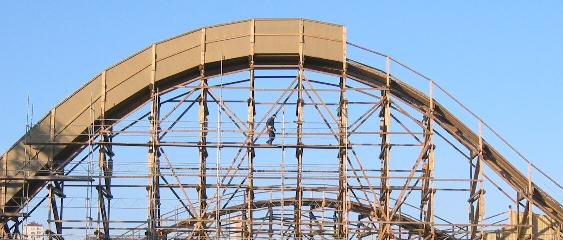 Figure 3: The section of Balder offering the longest airtime. The regular wooden structure provides "Balder coordinates", where the distance between horizontal beams is 2.50 m and the distance between vertical beams is, in most cases, 2.75 m. |
Many of the hills and valleys in Balder occur in sections of the track where the projection on the ground is a straight line and the only rotations are around the y-axis. With our coordinate conventions, a negative rotation marks a valley, e.g. following the first big drop. A positive rotation around the y-axis marks a hill. One example is shown in Figure 3, where the track offers a built-in "parabolic flight" and the rider experiences the longest period of near weightlessness. As in the case of rotations around the x-axis, the lack of large rotations around the y-axis shows that Balder involves no loops.
A complication in dealing with rotations is that only infinitesimal rotations commute. Converting motion tracker data to complete specifications of the motion involves matrix manipulation that are beyond reach for entering university students. In addition, the numerical accuracy may be insufficient to bring the virtual rider back to the point of departure, e.g. to the station. Nevertheless, the data can be used in many ways for student investigations, as discussed below.
The data shown in Figure 2 were taken during a relatively cold morning in June, before the park opened. The train was notably slower than usual, especially toward the end of the track. A visitor who would like to know the actual number of "g"s during a visit can use the stop watch on a mobile phone to measure the time required for the train to pass a given point. Combining this time measurement with a train length of about 15m, gives a value for the speed (although it is obvious that different parts of the train pass a hill or valley with somewhat different speeds). This value can then be compared to the speed estimate, v=ac/w, obtained from the values for the angular velocity and centripetal acceleration at that point.
Recording data during rides is a common and rewarding "science day" activity [6]. However, it also requires a considerable amount of equipment, managing and planning, as well as attention to safety. Even for a seasoned rider, a roller coaster is not the optimal place to try unfamiliar measuring equipment. Using data recorded in earlier measurements can shift the focus from data collection to data analysis and physics discussions, as found by teachers who have tried alternative formats. The combination with ground-based time measurements makes it possible to obtain results that may vary between different trips on a ride, thereby making it easier to maintain a feeling of authenticity.
During the project works during the students' first two months at university, we have also discovered that students, at least in Sweden, leave upper secondary school with habits of performing three measurements to work out an average of what needs to be measured. Still, they often have very vague ideas of measurement uncertainty, and often finish their report with an apology that the measurements may be insufficient for any conclusions at all. Based on this observation, next time, we will insist that several group members perform individual measurements for the time of passage of several trains, to bring a discussion of uncertainty in focus.
As always with project work, different groups of student show various degrees of enthusiasm, persistence and ambition, but in most cases, using authentic data in an enjoyable setting inspires students to try to understand the data and connect them to the experience of the body. One student had built a wooden model of the Top Spin ride for the presentation. One group showed 3D animations of two rides.
Many students discussed the difference in ride experience due to the position in the train; the smooth ride in Balder makes it impossible not to notice the difference. A few of the students also performed the calculations to work out the difference in g-force on the hills for different part of the train. Some students used the picture of the hill with the longest airtime (Figure 2), converted the "Balder coordinates" provided by the track to SI units and fit a polynomial for the curve.
When asked to draw a mindmap of acceleration, new students rarely refer to the experience of the body. Even if they are, in principle, aware of acceleration in circular motion, many of our entering students fall back to an understanding of acceleration as "increase of speed", possibly generalised to "change in speed". They would then tend to claim that the acceleration is zero on the top of a hill or in the bottom of a valley, where the speed has a minimum or maximum. We also find that many students may be able to work out the forces acting on the rider on a hill or in a valley, where all forces are along the same axis, but still have problems in more general two- or three-dimensional situations.
The quite unusual features of the Balder ride makes it a "special case" of roller coaster, easier to analyse than the full-fledged space curves of many other roller coasters. If the purpose of the project work is to help all students develop an understanding of forces in three dimensions, care should be taken to ensure that the Balder ride is complemented by other, more three-dimensional rides. The WWW pages of our Amusement Park Science project [7] includes physics tasks of mixed degrees of difficulty for most of the rides at Liseberg.
The analysis of student learning during a course involving amusement park project will be presented in a separate paper [8], with pre- and post-testing using the Force Concept Inventory, "FCI" [9], supplemented with additional questions.